Interactive Visualizations:
For teaching, research, and dissemination
Scott Hale, Josh Melville,
Kunika Kono, Helen Margetts,
Monica Bulger, Mark Graham
http://blogs.oii.ox.ac.uk/vis


Motivation
- Lots of data (esp. geospatial, network)
-
Lots of static, image visualizations
- More tools emerging for these
- Images loose depth, complexity of data
- Lack of elegant, easy-to-use tools for creating interactive visualizations
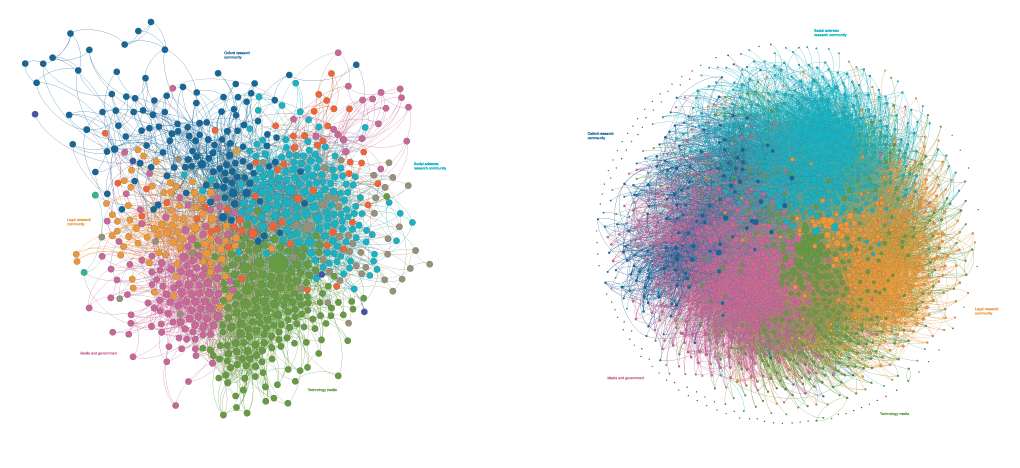
Followers of @oiioxford
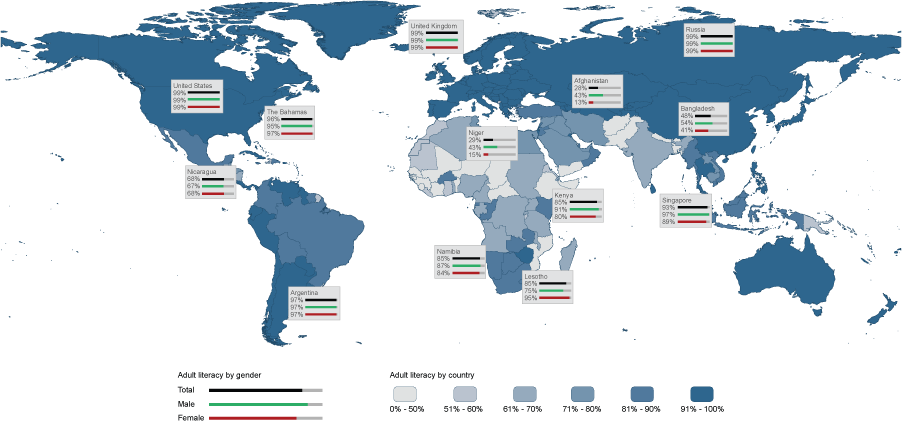
Literacy
Existing libraries, tools
Current parameters
- Native HTML5 visualizations
- CSS, HTML, SVG, Canvas (not Java, Flash, etc.)
- Standalone/Offline
- Can work in ebooks
- Can work on tablets once downloaded even if disconnected
- Network and geospatial data
Most importantly
- Easy to use
- Online interfaces to move from datafile to visualization
Why interactive?
- Multidimensionality of data (esp. 'Big Data')
- Encourage user/reader exploration
- Find specific values without returning to source data
What types of visualizations?
- Network diagrams
- World choropleth maps
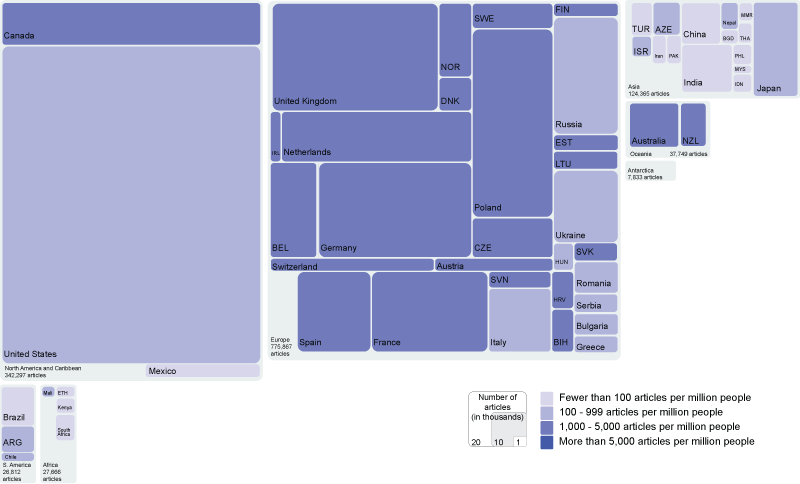
- Spatial treemaps
Live demo coming very soon
Live demo coming very soon
Spatial treemaps: Wikipedia articles
Project roadmap
- June:
- Survey existing libraries, tools
- Release intial mockups
- Solitict requirements, feedback
- July:
- Mockups iterated with new features
- Code cleaned, extensive browser testing
- August/September:
- Development of online hosted wizards
- Iterative progression with user feedback
- Final releases, sustainability plans
Next steps and You
- Feedback, needed features
- Chance to win prizes!
Interactive Visualizations:
For teaching, research, and dissemination
Scott Hale, Josh Melville,
Kunika Kono, Helen Margetts,
Monica Bulger, Mark Graham
http://blogs.oii.ox.ac.uk/vis